Objectives:
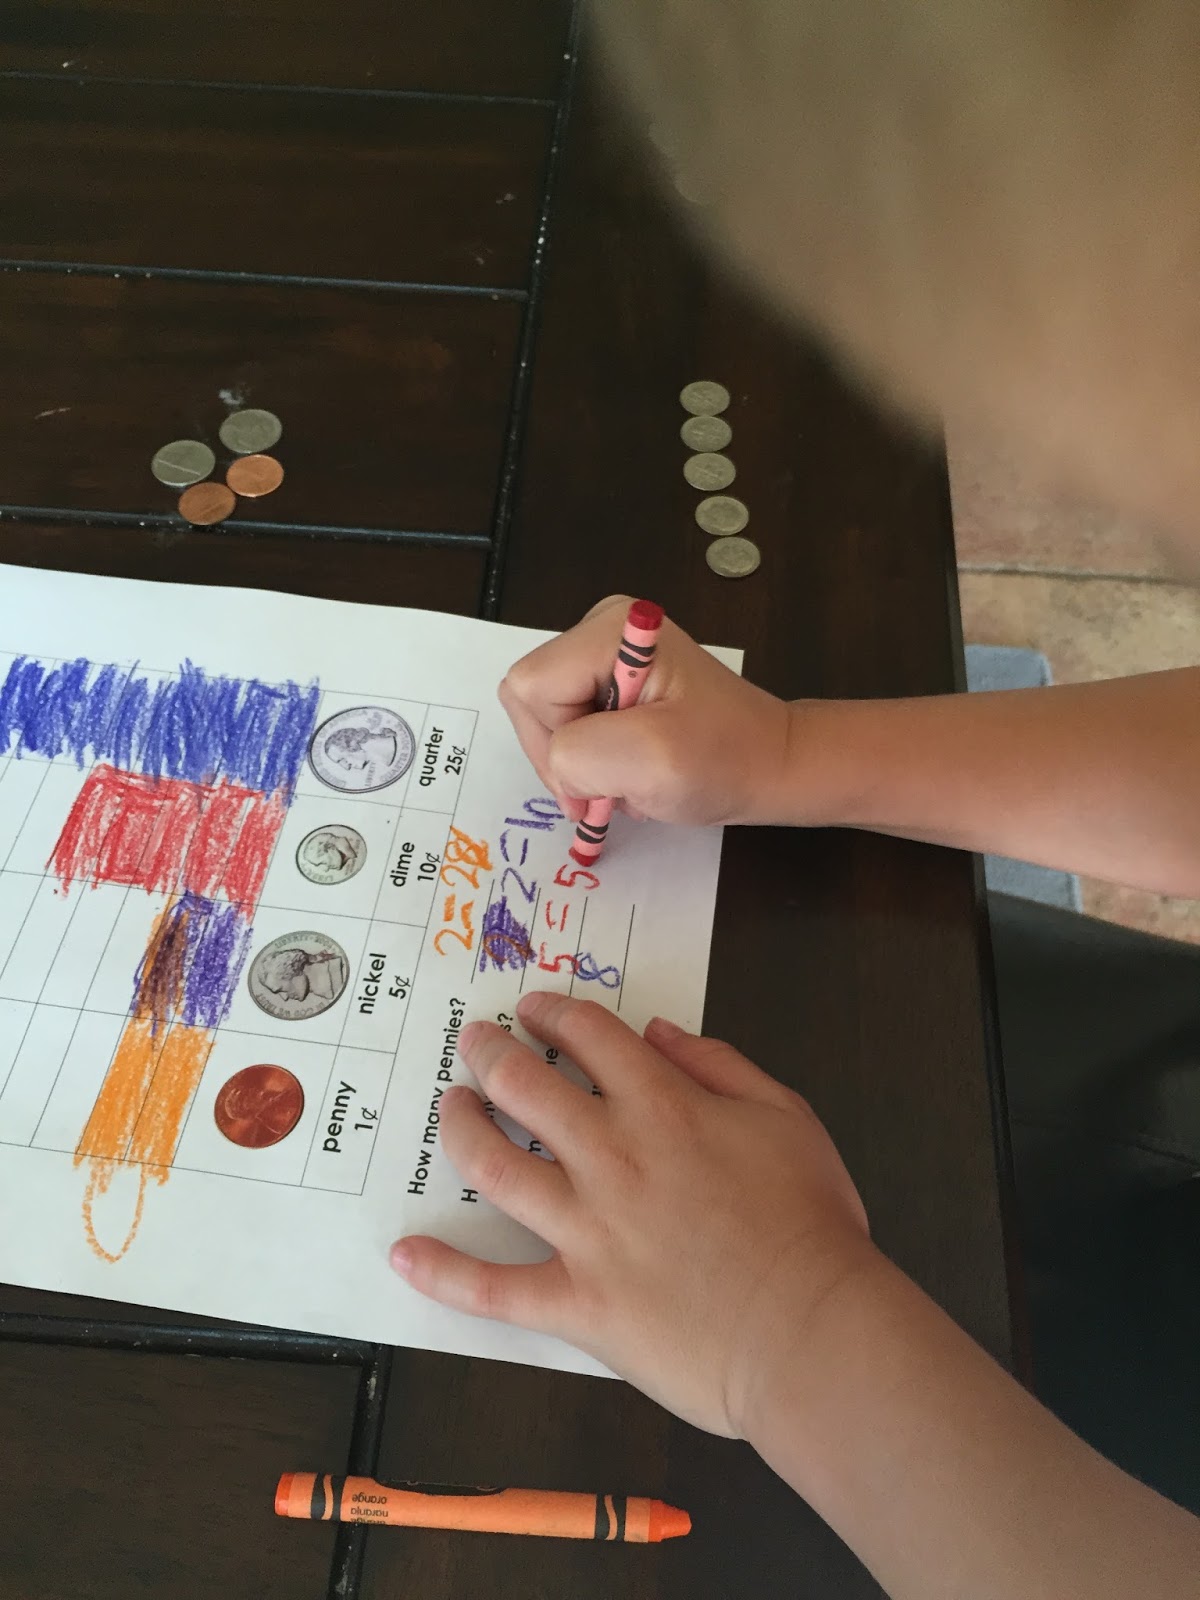
* To identify types of coins
* To sort coins into appropriate categories
* To count each group of coins and graph the number for each category
* To use graphing skills to determine most and least
Materials:
* Printable Graph from Keen on Kindergarten
* Handful of coins
* Crayons
Procedure:
* Have your children sort the coins into groups of the same type.
* Let them count the coins in each group and graph the correct number on their paper.
* Ask your child to determine which group had the most and the least.
* Extension: Have your child add up the monetary amount for each group. Then they could add all groups together to get the total amount for all of the coins.
Showing posts with label Graphing. Show all posts
Monday, June 1, 2015
Monday, October 29, 2012
Mighty Math Monday: Candy Graph
Objectives:
* To sort Halloween candy into categories of the same type
* To graph the number of candies in each category using a bar graph
* To analyze the results of the graph (most, least, equal amount, etc.)
Materials:
* Candy Graph Printable from me :)
* Crayons
* Tape
* Halloween Candy
Procedure:
* You can use this graph with any types of candy, but this lesson coordinates around Halloween so your children can graph the kinds of candy they receive while trick or treating. I am doing this a few days early so you can have it, so we are just using a bag of assorted candy.
* Let your child dump out all of the candy they have and sort it into groups. You can do the same type of candy, chocolate vs. non-chocolate, large pieces vs. small pieces, etc. Whatever you want! :)
* Of course your child will want to eat some of the candy as they go, so tape the wrappers to the bottom of the graph according to the different types of candy you have. Your child could draw each piece, as well.
* Have your child count the number of candies in each group and then color each column in the graph according to the results.
* Once the graph is complete, ask your child which group of candy has the most, least, equal amounts, etc.
* Enjoy eating some more! :)
* To sort Halloween candy into categories of the same type
* To graph the number of candies in each category using a bar graph
* To analyze the results of the graph (most, least, equal amount, etc.)
Materials:
* Candy Graph Printable from me :)
* Crayons
* Tape
* Halloween Candy
Procedure:
* You can use this graph with any types of candy, but this lesson coordinates around Halloween so your children can graph the kinds of candy they receive while trick or treating. I am doing this a few days early so you can have it, so we are just using a bag of assorted candy.
* Let your child dump out all of the candy they have and sort it into groups. You can do the same type of candy, chocolate vs. non-chocolate, large pieces vs. small pieces, etc. Whatever you want! :)
* Of course your child will want to eat some of the candy as they go, so tape the wrappers to the bottom of the graph according to the different types of candy you have. Your child could draw each piece, as well.
* Have your child count the number of candies in each group and then color each column in the graph according to the results.
* Once the graph is complete, ask your child which group of candy has the most, least, equal amounts, etc.
* Enjoy eating some more! :)
Subscribe to:
Posts (Atom)


